
As per Insurance Information Institutes research, USA hospitals record over 3.3 million sports-related injuries a year. We wanted to fully understand what’s causing all of these injuries and what the risks are for each age group.
Key Facts
- More than 1.2 MILLION children are hospitalized each year while playing sports
- Projections show that 60-75% of injuries never get treated at the hospitals and are not officially recorded.
- Actual numbers are estimated to be as many as 9 million injuries a year across all age groups.
Injuries by Age Groups
In this study, we also took a deep dive into age groups to look at which sports most the highest risk for every age group
- Under 15’s – The most dangerous sports for children include Football, Soccer, and Baseball.
- Young People (15-24) – The highest percentage of injuries were recorded while playing Basketball, Volleyball, and Hockey.
- Adults (25+) – Horseback riding, Boxing, and Martial record the highest percent of injuries for adults over 25 years old.
It’s a no brainer that Under 15’s suffer most from popular youth sports like Football, Soccer and Baseball, although it’s quite surprisingly to see these non-contact sports racking up so many injuries.
For the older age brackets, Horseback riding comes as the biggest surprise given the extensive training and professionalism within the sport.
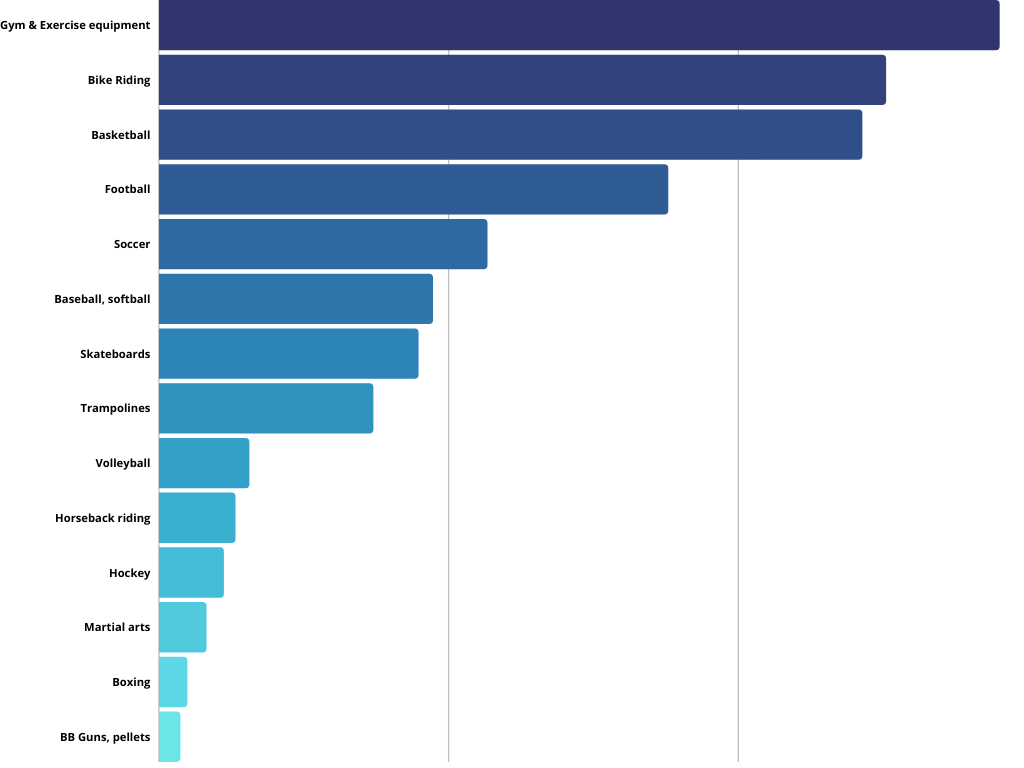
Most Vs. Least harmful Sports
Next, we decided to analyse the most and least harmful sports across all age groups. The results were quite interesting here as it turns out that most “high risk” sports are much safer than everyday cardio sports like bike riding and gym equipment.
- Gym & Bike riding account for more than a quarter of all sports-related injuries
- Boxing accounts for less than 0.5% of all injuries a year across all age groups.
- Even Bowling is more dangerous than Boxing – 16 615 vs. 16 071 injuries a year.
Other Key Facts
Elsewhere in the study, we uncovered a number of other fascinating facts, including…
- Typical “dangerous” sports such as boxing only account for less than 1% of all injuries
- More people get hurt Fishing and Camping than in contact sports like Martial Arts.
- Trampolines alone amount for 2x more injuries than Boxing, Martial Arts, and Hockey combined.
- The Sports Medicine industry makes over 8.1 BILLION USD a year profiting from sports injuries
- Adults and Children are both equally injured by BB Guns each year indicating a worrying lack of regulation
So there we have it. We were very surprised to understand which sports are causing the most harm, and perhaps the biggest eye opener here is the risk of everyday activities such as Gym going and Cycling.
One thing for sure here is that the medical industry is perhaps the only winner in all of this!
The Data
Bellow you can find the full dataset and analysis to pick apart and draw your own conclusions from.
| Sport, activity or equipment | Injuries | Younger than 5 | 5 to 14 | 15 to 24 | 25 to 64 | 65 and older |
| Exercise, exercise equipment | 468,315 | 6,266 | 46,926 | 87,189 | 250,747 | 77,187 |
| Bicycles and accessories | 417,485 | 12,691 | 113,445 | 58,072 | 191,049 | 42,228 |
| Basketball | 403,980 | 1,250 | 139,733 | 185,316 | 76,066 | 1,615 |
| Football | 292,306 | 429 | 149,149 | 116,946 | 25,131 | 651 |
| Playground equipment | 222,527 | 54,372 | 148,577 | 7,256 | 10,376 | 1,946 |
| ATV’s, mopeds, minibikes, etc. | 201,847 | 4,407 | 37,831 | 51,686 | 89,833 | 18,090 |
| Swimming, pools, equipment | 190,743 | 21,811 | 77,296 | 31,309 | 47,457 | 12,871 |
| Soccer | 188,336 | 2,060 | 84,938 | 71,030 | 29,569 | 739 |
| Baseball, softball | 157,164 | 2,380 | 65,058 | 48,188 | 38,211 | 3,327 |
| Skateboards | 148,921 | 2,837 | 46,071 | 51,864 | 44,891 | 3,257 |
| Trampolines | 123,029 | 23,979 | 74,378 | 12,711 | 11,625 | 336 |
| Lacrosse, rugby, misc. ball games | 74,326 | 163 | 28,310 | 22,613 | 13,371 | 9,869 |
| Skating (excl. In-line) | 67,008 | 833 | 31,293 | 12,980 | 20,611 | 1,291 |
| Fishing | 61,932 | 1,926 | 11,987 | 9,542 | 31,028 | 7,449 |
| Volleyball | 51,455 | 32 | 18,479 | 22,652 | 9,674 | 618 |
| Horseback riding | 43,469 | 963 | 8,200 | 9,650 | 20,563 | 4,093 |
| Hockey | 36,885 | 200 | 12,268 | 14,951 | 9,060 | 407 |
| Track and field activities, equipment | 28,048 | 0 | 11,287 | 12,274 | 4,189 | 298 |
| Martial arts | 27,008 | 288 | 7,720 | 6,868 | 11,583 | 549 |
| Racquet sports | 25,844 | 250 | 3,408 | 4,091 | 9,229 | 8,867 |
| Beach, picnic, camping equipment | 25,728 | 2,803 | 4,391 | 2,526 | 11,797 | 4,212 |
| Water skiing, tubing, surfing | 18,143 | 98 | 2,186 | 5,932 | 9,389 | 538 |
| Bowling | 16,615 | 938 | 1,293 | 2,478 | 7,762 | 4,145 |
| Boxing | 16,071 | 23 | 2,001 | 7,000 | 6,976 | 71 |
| Nonpowder guns, BB’S, pellets | 11,995 | 369 | 3,583 | 4,052 | 3,460 | 530 |
| Toboggans, sleds, snow discs, etc. | 10,661 | 942 | 4,950 | 1,255 | 3,398 | 115 |